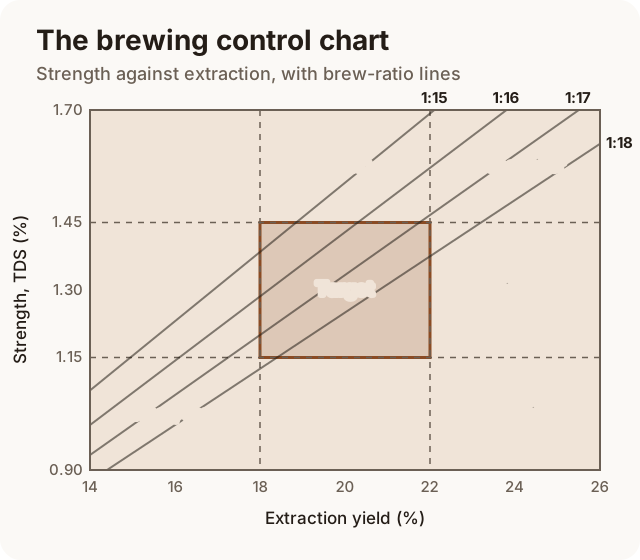
The coffee brewing control chart plots two numbers against each other: how strong the coffee is, measured as total dissolved solids (TDS), and how much of the coffee dissolved, the extraction yield. The widely used target for filter coffee is an extraction of 18 to 22% at a strength of about 1.15 to 1.45% TDS. Inside that box, most people find coffee sweet and balanced; outside it, the chart tells you whether to change the grind or the ratio.
You do not need a chart, or the tool that measures TDS, to make excellent coffee. Taste does the same job. But the chart is the clearest picture of how brewing works, and once you understand it, every “grind finer” or “use more coffee” on this site makes sense.
The two numbers
TDS, or total dissolved solids, is strength. It is the percentage of the drink that is dissolved coffee; the rest is water. A cup of filter coffee at 1.35% TDS is 1.35% coffee and 98.65% water. Espresso is far stronger, usually 8 to 12%.
Extraction yield is how much of the coffee ended up in the cup. It is the weight of dissolved coffee in the drink divided by the weight of dry grounds you started with. Only about 30% of a roasted bean can dissolve at all, and the best-tasting cups usually take 18 to 22% of it. Below that, the cup tastes sour and thin; above it, bitter and drying. Coffee extraction, explained covers why.
The two are independent. Strength is set mostly by the ratio of coffee to water; extraction is set by grind, time, temperature, and agitation. The chart puts them on two axes so you can see both at once.
How to read the chart
The chart divides into nine zones. Extraction runs from left to right, under-extracted to over-extracted. Strength runs from bottom to top, weak to strong.
| Under-extracted (below 18%) | Well extracted (18–22%) | Over-extracted (above 22%) | |
|---|---|---|---|
| Strong (above 1.45%) | Strong, sour | Strong | Strong, bitter |
| In range (1.15–1.45%) | Sour | Target | Bitter |
| Weak (below 1.15%) | Weak, sour | Weak | Weak, bitter |
Moving left or right means changing extraction, so you change the grind, the time, the temperature, or the agitation. Moving up or down means changing strength, so you change the ratio, or add water after brewing.
The brew-ratio lines
The diagonal lines are what make the chart useful for planning. Each one shows every result you can get from one brew ratio. If you brew at 1:16, your cup will land somewhere on the 1:16 line: further right if you extract more, further left if you extract less. You cannot leave the line without changing the ratio.
The lines slope upward because extracting more puts more coffee into the same water, so the cup gets stronger as well. This table shows where common ratios land, assuming, as the rest of the site does, that the wet grounds hold on to twice their weight in water:
| Ratio | TDS at 18% extraction | at 20% | at 22% |
|---|---|---|---|
| 1:15 | 1.38% | 1.54% | 1.69% |
| 1:16 | 1.29% | 1.43% | 1.57% |
| 1:17 | 1.20% | 1.33% | 1.47% |
| 1:18 | 1.13% | 1.25% | 1.38% |
Two things fall out of that table. First, a good ratio for filter coffee is somewhere around 1:16 to 1:17: those are the lines that run through the middle of the target. Second, the same extraction tastes stronger or weaker depending on the ratio, which is why a cup can be perfectly extracted and still too strong. Bypass water is the tool for that.
Where the target came from
The chart dates to the 1950s, when the chemist Ernest Earl Lockhart ran taste studies with American coffee drinkers for the Coffee Brewing Institute. The ideal zone came from what those panels preferred, and it became the basis of the “Golden Cup” standard used for decades to certify brewers.
The target box is not universal. Different organisations settled on slightly different boxes, reflecting what their coffee drinkers liked:
| Standard | Extraction | TDS |
|---|---|---|
| Specialty Coffee Association of America (US) | 18–22% | 1.15–1.35% |
| Specialty Coffee Association of Europe | 18–22% | 1.20–1.45% |
| Norwegian Coffee Association | 18–22% | 1.30–1.55% |
The extraction range is the same everywhere; only the preferred strength differs. This site uses 1.15–1.45%, which covers both the American and European boxes.
More recent research from the UC Davis Coffee Center, working with the Specialty Coffee Association, revisited the chart with modern sensory panels. Its main finding is a useful one for home brewers: coffee drinkers fall into groups with genuinely different preferences, some liking stronger cups and some lighter ones, and no single box suits everyone. The extraction range still predicts sour and bitter well. Strength is more personal.
How to measure TDS
TDS is measured with a coffee refractometer. It shines light through a few drops of coffee and measures how much the light bends, which rises with the amount dissolved in it. Long-standing makers include VST and Atago; cheaper digital models have appeared more recently.
- Weigh the drink. Put the server or mug on the scale before you brew and tare it, so you know how much coffee is in the cup at the end.
- Stir and take a sample. The coffee that drips through last is weaker than the first, so stir the whole cup before you take a few drops with a pipette.
- Cool the sample to around room temperature. Most refractometers correct for temperature, but a hot sample still gives jumpier readings. Cover it so it does not evaporate and read stronger than it is.
- Zero the meter with a few drops of the same water you brewed with, at the same temperature.
- Read it two or three times and take the average.
For espresso, many people pass the sample through a small syringe filter first, because the undissolved oils and particles in a shot can push the reading up. Paper-filtered coffee does not need it.
A water TDS pen will not work. The cheap pens sold for testing water measure electrical conductivity, which tracks dissolved minerals. Most of what dissolves from coffee does not conduct electricity in the same way, so the reading means nothing. They are good for checking your water, not your coffee.
How to calculate extraction yield
For pourover, drip, AeroPress, and espresso, where the coffee drains out of the grounds:
Extraction yield = TDS × weight of drink ÷ weight of dry coffee
For a French press, cold brew, or any brew where the grounds steep in all the water, use the total water weight instead of the weight of the drink. The water left in the grounds is the same strength as the water you poured off, so it counts too. That gives a close estimate.
Three worked examples:
| Brew | Dose | Drink | TDS | Dissolved coffee | Extraction |
|---|---|---|---|---|---|
| Pourover | 20g | 280g | 1.35% | 3.8g | 19% |
| French press | 30g | 480g of water | 1.25% | 6.0g | 20% |
| Espresso | 18g | 36g | 9.5% | 3.4g | 19% |
All three are in the target range for extraction, though they are very different drinks. That is the point of the second number: extraction tells you the brew went right; TDS tells you how strong it came out.
Turning numbers into changes
The measurements point to the same fixes as your tongue does, just with more certainty.
| Reading | Means | Change |
|---|---|---|
| Extraction under 18% | Under-extracted | Grind finer |
| Extraction over 22% | Over-extracted | Grind coarser |
| Extraction in range, TDS too high | Too strong | More water, or add water after brewing |
| Extraction in range, TDS too low | Too weak | More coffee |
| Both in range, but it tastes sour and bitter at once | Uneven extraction | See channeling, fines, and agitation |
A worked case: a 20g pourover with 320g of water gives 280g of coffee at 1.25% TDS. That is 3.5g dissolved, a 17.5% extraction: just under the range, and it probably tastes a little sour. Grind one step finer. The next cup reads 1.40% TDS, about 3.9g dissolved, so roughly 19.6%. In range. If it now tastes slightly too strong, add a splash of hot water to the cup rather than changing the grind again.
Change one thing at a time, just as you would by taste. Calibrating the grind covers how far one step should move the cup.
What the chart cannot tell you
- Whether you like it. The target box is where most people’s preferences cluster, not a rule. If a cup tastes great at 23%, it is a great cup.
- Whether the extraction was even. A brew where some grounds extracted 26% and others 14% can average 20% and still taste sour and bitter at once. The refractometer only sees the average. Channeling, fines, and agitation covers why that happens.
- Roast level. Light roasts are harder to extract and often taste best at the high end of the range, around 20 to 22%. Dark roasts extract easily and tend to taste best lower, around 18 to 20%. See light vs dark roast.
- Exact retention. Grounds hold close to twice their weight in water, but it varies with the grind and the brewer. Weigh the drink rather than estimating it.
Is a refractometer worth buying?
For most home brewers, no. A scale, a timer, and paying attention to taste get you almost all the way, and the Brew Compass turns what you taste into the next change. A refractometer is worth it if you:
- run a café or brew for a lot of people, and need every batch to match;
- are comparing grinders, filters, or recipes, and want to separate a real difference from a hunch;
- are learning to taste, and want to check what you think you are tasting against a number.
If you buy one, start by measuring cups you already like. The numbers are most useful as a record of your own preferences, which you can then repeat.